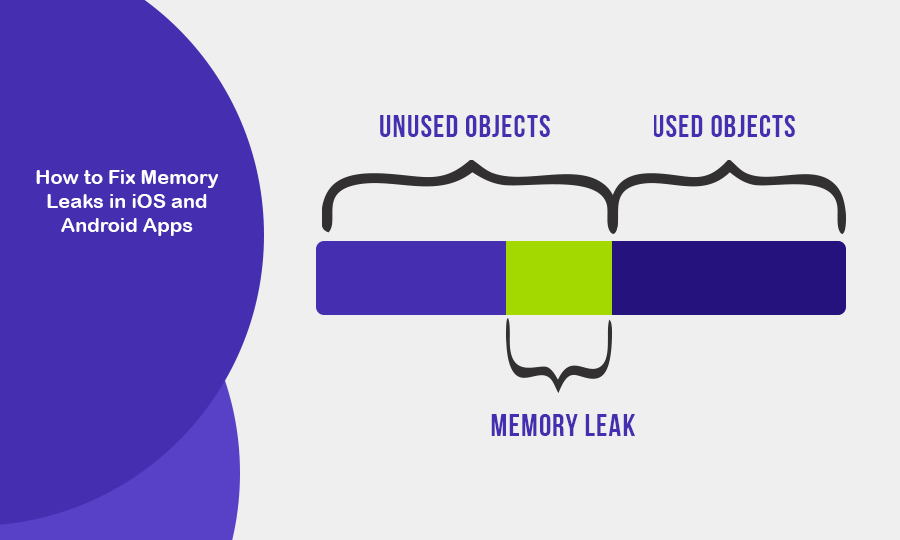
Mobile applications are expected to deliver smooth performance and efficient resource management. One of the critical issues that can degrade performance is memory leaks, which occur when an app retains references to objects that are no longer needed, causing excessive memory consumption. Memory leaks, if left unchecked, can result in degraded app performance, crashes, and poor user experience.
In this guide, we'll explore strategies to identify, prevent, and fix memory leaks in iOS and Android applications, with insights into best practices, tools, and techniques commonly used by custom mobile application development companies.
What is a Memory Leak?
A memory leak happens when an app retains objects in memory that are no longer required, and these objects cannot be released. This occurs when objects have strong references that aren’t properly released, resulting in increased memory usage over time, which leads to performance issues and eventually crashes due to “Out of Memory” (OOM) errors.
Causes of Memory Leaks in Mobile Apps
In both iOS and Android, memory leaks primarily stem from:
1. Circular References: Two or more objects reference each other, preventing the garbage collector from deallocating them.
2. Incorrect Use of Singleton Patterns: Mismanaged singletons can cause objects to persist longer than intended.
3. Improper Management of Large Objects: Loading large objects like images without properly managing memory can lead to leaks.
4. Listeners and Callbacks: If listeners or callbacks aren’t removed correctly, they hold references to objects that prevent proper garbage collection.

Fixing Memory Leaks in iOS Apps
1. Using Instruments for Leak Detection
Xcode provides robust tools for iOS developers to detect and address memory leaks. The Instruments tool has a Leaks and Allocations feature, which helps identify memory leaks during runtime. Here’s how you can use it:
- Open Xcode Instruments from the toolbar.
- Select Profile > Leaks to initiate memory profiling.
- Run the app and monitor its memory usage. The tool will highlight objects that remain in memory longer than necessary.
2. Breaking Retain Cycles
Retain cycles are a common cause of memory leaks in iOS, particularly when using closures. In Swift, closures capture references to objects, which can create retain cycles. To fix this, use weak or unowned references:
- Weak: An optional reference that will be set to `nil` once the object is deallocated. Suitable for use when an object may become `nil`.
- Unowned: A non-optional reference that will never be `nil`. Use this when you’re certain the object will not deallocate before the reference is used.
For instance, when capturing `self` inside a closure, prefix it with `[weak self]` to avoid a strong reference cycle.
3. Deallocating Objects Correctly
Ensure that objects such as view controllers, listeners, and delegates are properly released. For example, set delegate properties as weak to ensure that they do not retain objects unnecessarily.
4. Best Practices in iOS Development
To avoid memory leaks:
- Always remove observers and notifications once they’re no longer needed.
- Implement proper object deallocation by overriding the deinit method.
- Conduct regular code reviews and use static analysis tools like SwiftLint to enforce best practices.
Fixing Memory Leaks in Android Apps
1. Using LeakCanary for Detection
LeakCanary is a popular tool for detecting memory leaks in Android apps. It provides automatic leak detection during development, helping developers identify leaks before they reach production.
To set it up:
- Add LeakCanary to your project’s dependencies.
- Run the app, and LeakCanary will notify you if any leaks occur, displaying the leaking objects and stack traces. This is invaluable in pinpointing exactly where the leak is happening.
LeakCanary works by monitoring the lifecycle of activities and fragments and detecting objects that persist longer than their lifecycle.
2. Android Studio Profiler
The Memory Profiler in Android Studio is another powerful tool that helps visualize memory usage. It tracks objects in memory and lets you manually trigger garbage collection to see which objects are still being retained. You can use this tool to:
- Record memory allocations.
- Dump the Java heap and analyze it to identify objects that are unnecessarily retained.
3. Handling Context Properly
One of the most common sources of memory leaks in Android is improper context usage. Avoid holding references to activities or contexts within long-lived objects, as this can prevent the activity from being garbage collected. Instead:
- Use application context where possible, especially in background services or utility classes.
- Avoid static references to views, activities, or fragments, which can cause leaks due to their persistence beyond their intended lifecycle.
4. Avoiding Leaks with AsyncTasks and Handlers
AsyncTasks and Handlers are another common cause of memory leaks, especially if they hold references to an activity. Ensure that they are properly canceled or completed when the activity is destroyed. A common approach is to use weak references to hold references to activities within AsyncTasks or Handlers.
5. Best Practices in Android Development
- Always remove callbacks or listeners when they’re no longer needed.
- Use WeakReference for objects that should not prevent garbage collection.
- Ensure that background tasks are stopped when the activity or fragment is destroyed.

General Tips for Both Platforms
1. Adopt Proper Memory Management Techniques
Effective memory management practices are essential in both iOS and Android development. For example:
- In iOS, utilize Automatic Reference Counting (ARC) to manage memory efficiently.
- In Android, leverage Java’s built-in garbage collection but ensure that you avoid memory leaks by releasing references when objects are no longer needed.
2. Use Debugging Tools Early and Often
Whether using Xcode Instruments or LeakCanary, make memory profiling part of your development process from the start. By identifying potential leaks early, you can prevent bigger issues from surfacing later in production.
3. Leverage the Experience of Custom App Developers
A custom mobile app development company specializing in memory optimization can provide deep insights and specialized services to identify and resolve memory issues. Companies offering custom Android app development services often have extensive experience using advanced memory management tools like MAT (Memory Analyzer Tool) for heap dump analysis, helping to ensure that your application runs efficiently.
Final Words on How to Fix Memory Leaks in iOS and Android Apps
Memory leaks are a challenging but solvable issue in both iOS and Android development. By adopting best practices, using profiling tools, and ensuring proper memory management techniques, developers can reduce memory leaks, improve app performance, and provide a seamless user experience. Whether working with a custom app development company or as an independent developer, focusing on memory optimization is crucial to ensuring the longevity and success of your mobile application.
By leveraging tools like Xcode Instruments, LeakCanary, and applying the strategies discussed, you can effectively manage memory and prevent leaks in your mobile applications, delivering a more polished product to your users.


